Prepare modeling data for GIS analyses#
The most common way to work with climate modeling data sets is storing them in NetCDF or GRIB format and processing them using Xarray. Raster data sets used in GIS applications are usually stored in raster formats such as GeoTIFF, BIL, or IMG and being processed mainly with the help of GDAL-based python libraries. While modeling data sets are normally georeferenced using grids explicitly described by coordinates and conforming to e.g., CF sandard, geographic reference of GIS data sets is described by a coordinate reference system (CRS). This diferences imply some steps that need to be undertaken in order to convert data sets from one format to another.
In this notebook we create an aggregated map of pre-industrial Vertically Averaged Sea Water Potential Temperature (thetaot) from CMIP6 and save it as GeoTIFF.
First, we import all necessary libraries.
%matplotlib inline
import intake, requests, aiohttp
import matplotlib.pyplot as plt
import cartopy.crs as ccrs
import numpy as np
import xarray as xr
import cf_xarray as cfxr
import xesmf as xe
import scipy.sparse as sps

# Rioxarray is an experimental interface between Xarray and Rasterio libraries
# made for loading GDAL-readable rasters as xarray datasets and saving xarrays as raster files.
import rioxarray
#print("Using roocs/clisops in version %s" % cl.__version__)
print("Using xESMF in version %s" % xe.__version__)

xr.set_options(display_style = "html");

import warnings
warnings.simplefilter("ignore")
ERROR 1: PROJ: proj_create_from_database: Open of /envs/share/proj failed
---------------------------------------------------------------------------
KeyError                                  Traceback (most recent call last)
File /envs/lib/python3.11/site-packages/esmpy/interface/loadESMF.py:26
     25 try:
---> 26     esmfmk = os.environ["ESMFMKFILE"]
     27 except:

File <frozen os>:679, in __getitem__(self, key)

KeyError: 'ESMFMKFILE'

During handling of the above exception, another exception occurred:

ImportError                               Traceback (most recent call last)
File /envs/lib/python3.11/site-packages/xesmf/backend.py:22
     21 try:
---> 22     import esmpy as ESMF
     23 except ImportError:

File /envs/lib/python3.11/site-packages/esmpy/__init__.py:112
    110 #### IMPORT LIBRARIES #########################################################
--> 112 from esmpy.api.esmpymanager import *
    113 from esmpy.api.grid import *

File /envs/lib/python3.11/site-packages/esmpy/api/esmpymanager.py:9
      7 #### IMPORT LIBRARIES #########################################################
----> 9 from esmpy.interface.cbindings import *
     11 from esmpy.api.constants import *

File /envs/lib/python3.11/site-packages/esmpy/interface/cbindings.py:13
     12 from esmpy.util.decorators import *
---> 13 from esmpy.interface.loadESMF import _ESMF
     16 def copy_struct(src):

File /envs/lib/python3.11/site-packages/esmpy/interface/loadESMF.py:28
     27 except:
---> 28     raise ImportError('The ESMFMKFILE environment variable is not available.')
     30 #### INVESTIGATE esmf.mk ######################################################
     31
     32 # TODO: look for various dependecies in the ESMF build log
   (...)
     37 #       use this information to set variables that can be checked at beginning
     38 #       of the routines that require an ESMF build with these dependencies

ImportError: The ESMFMKFILE environment variable is not available.

During handling of the above exception, another exception occurred:

ModuleNotFoundError                       Traceback (most recent call last)
Cell In[1], line 8
      6 import xarray as xr
      7 import cf_xarray as cfxr
----> 8 import xesmf as xe
      9 import scipy.sparse as sps
     11 # Rioxarray is an experimental interface between Xarray and Rasterio libraries
     12 # made for loading GDAL-readable rasters as xarray datasets and saving xarrays as raster files.

File /envs/lib/python3.11/site-packages/xesmf/__init__.py:4
      1 # flake8: noqa
      3 from . import data, util
----> 4 from .frontend import Regridder, SpatialAverager
      6 try:
      7     from ._version import __version__

File /envs/lib/python3.11/site-packages/xesmf/frontend.py:12
      9 import xarray as xr
     10 from xarray import DataArray, Dataset
---> 12 from .backend import Grid, LocStream, Mesh, add_corner, esmf_regrid_build, esmf_regrid_finalize
     13 from .smm import (
     14     _combine_weight_multipoly,
     15     _parse_coords_and_values,
   (...)
     19     read_weights,
     20 )
     21 from .util import LAT_CF_ATTRS, LON_CF_ATTRS, split_polygons_and_holes

File /envs/lib/python3.11/site-packages/xesmf/backend.py:24
     22     import esmpy as ESMF
     23 except ImportError:
---> 24     import ESMF
     25 import numpy as np
     26 import numpy.lib.recfunctions as nprec

ModuleNotFoundError: No module named 'ESMF'
1. Find and load the data set#
Then we find the data set we need in the DKRZ open catalogue and print its metadata.
# Path to master catalog on the DKRZ server
#dkrz_catalog=intake.open_catalog(["https://dkrz.de/s/intake"])
#
#only for the web page we need to take the original link:
dkrz_catalog=intake.open_catalog(["https://gitlab.dkrz.de/data-infrastructure-services/intake-esm/-/raw/master/esm-collections/cloud-access/dkrz_catalog.yaml"])
# Print DKRZ open catalogues
list(dkrz_catalog)
['dkrz_cmip5_archive',
 'dkrz_cmip5_disk',
 'dkrz_cmip6_cloud',
 'dkrz_cmip6_disk',
 'dkrz_cordex_disk',
 'dkrz_dyamond-winter_disk',
 'dkrz_era5_disk',
 'dkrz_monsoon_disk',
 'dkrz_mpige_disk',
 'dkrz_nextgems_disk',
 'dkrz_palmod2_disk']
# Open the catalog with the intake package and name it "col" as short for "collection"
cols=dkrz_catalog._entries["dkrz_cmip6_disk"]._open_args["read_csv_kwargs"]["usecols"]+["opendap_url"]
col=dkrz_catalog.dkrz_cmip6_disk(read_csv_kwargs=dict(usecols=cols))
cat = col.search(variable_id = "thetaot",
                 experiment_id = "historical",
                time_range = "185001-194912",
                member_id = "r1i1p1f3"
                )
cat.df
| activity_id | institution_id | source_id | experiment_id | member_id | table_id | variable_id | grid_label | dcpp_init_year | version | time_range | opendap_url | project | format | uri | |
|---|---|---|---|---|---|---|---|---|---|---|---|---|---|---|---|
| 0 | CMIP | MOHC | HadGEM3-GC31-LL | historical | r1i1p1f3 | Emon | thetaot | gn | NaN | v20200210 | 185001-194912 | http://esgf3.dkrz.de/thredds/dodsC/cmip6/CMIP/... | CMIP6 | netcdf | /work/ik1017/CMIP6/data/CMIP6/CMIP/MOHC/HadGEM... |
dset = xr.open_dataset(cat.df.uri.values[0], chunks = {"time": 6})
dset["thetaot"]
<xarray.DataArray 'thetaot' (time: 1200, j: 330, i: 360)>
dask.array<open_dataset-thetaot, shape=(1200, 330, 360), dtype=float32, chunksize=(6, 330, 360), chunktype=numpy.ndarray>
Coordinates:
  * time       (time) object 1850-01-16 00:00:00 ... 1949-12-16 00:00:00
  * j          (j) int32 0 1 2 3 4 5 6 7 8 ... 322 323 324 325 326 327 328 329
  * i          (i) int32 0 1 2 3 4 5 6 7 8 ... 352 353 354 355 356 357 358 359
    latitude   (j, i) float32 dask.array<chunksize=(330, 360), meta=np.ndarray>
    longitude  (j, i) float32 dask.array<chunksize=(330, 360), meta=np.ndarray>
Attributes:
    standard_name:  sea_water_potential_temperature
    long_name:      Vertically Averaged Sea Water Potential Temperature
    comment:        Vertical average of the sea water potential temperature t...
    units:          degC
    original_name:  mo: level_mean((variable_name: thetao), (variable_name: t...
    cell_methods:   area: depth: time: mean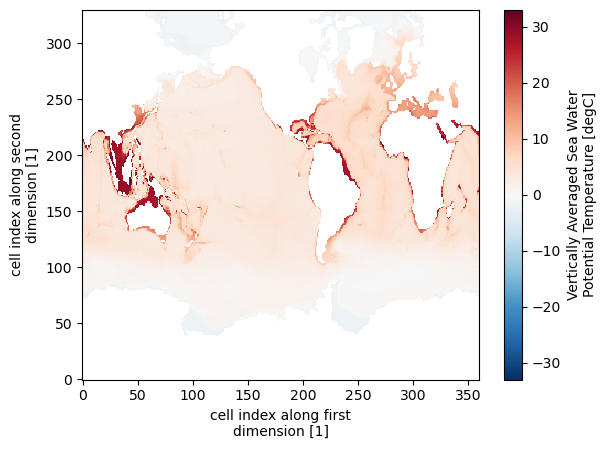
cell_measures: area: areacelloAs we can see, coordinates are stored as arrays of grid cell indices, which is not a common format in the GIS community.
2. Calculate pre-industrail mean#
We make a subset limiting the data set to pre-industrial era, calculate the mean values per grid cell, and plot the result.
dset["time"] = dset["time"].dt.strftime("%Y%m%d")
pre_industrial = dset["thetaot"].sel(time = slice("1850", "1880"))
pre_industrial_mean = pre_industrial.mean(dim = "time", keep_attrs = True)
pre_industrial_mean.plot()
<matplotlib.collections.QuadMesh at 0x7f4933724cd0>
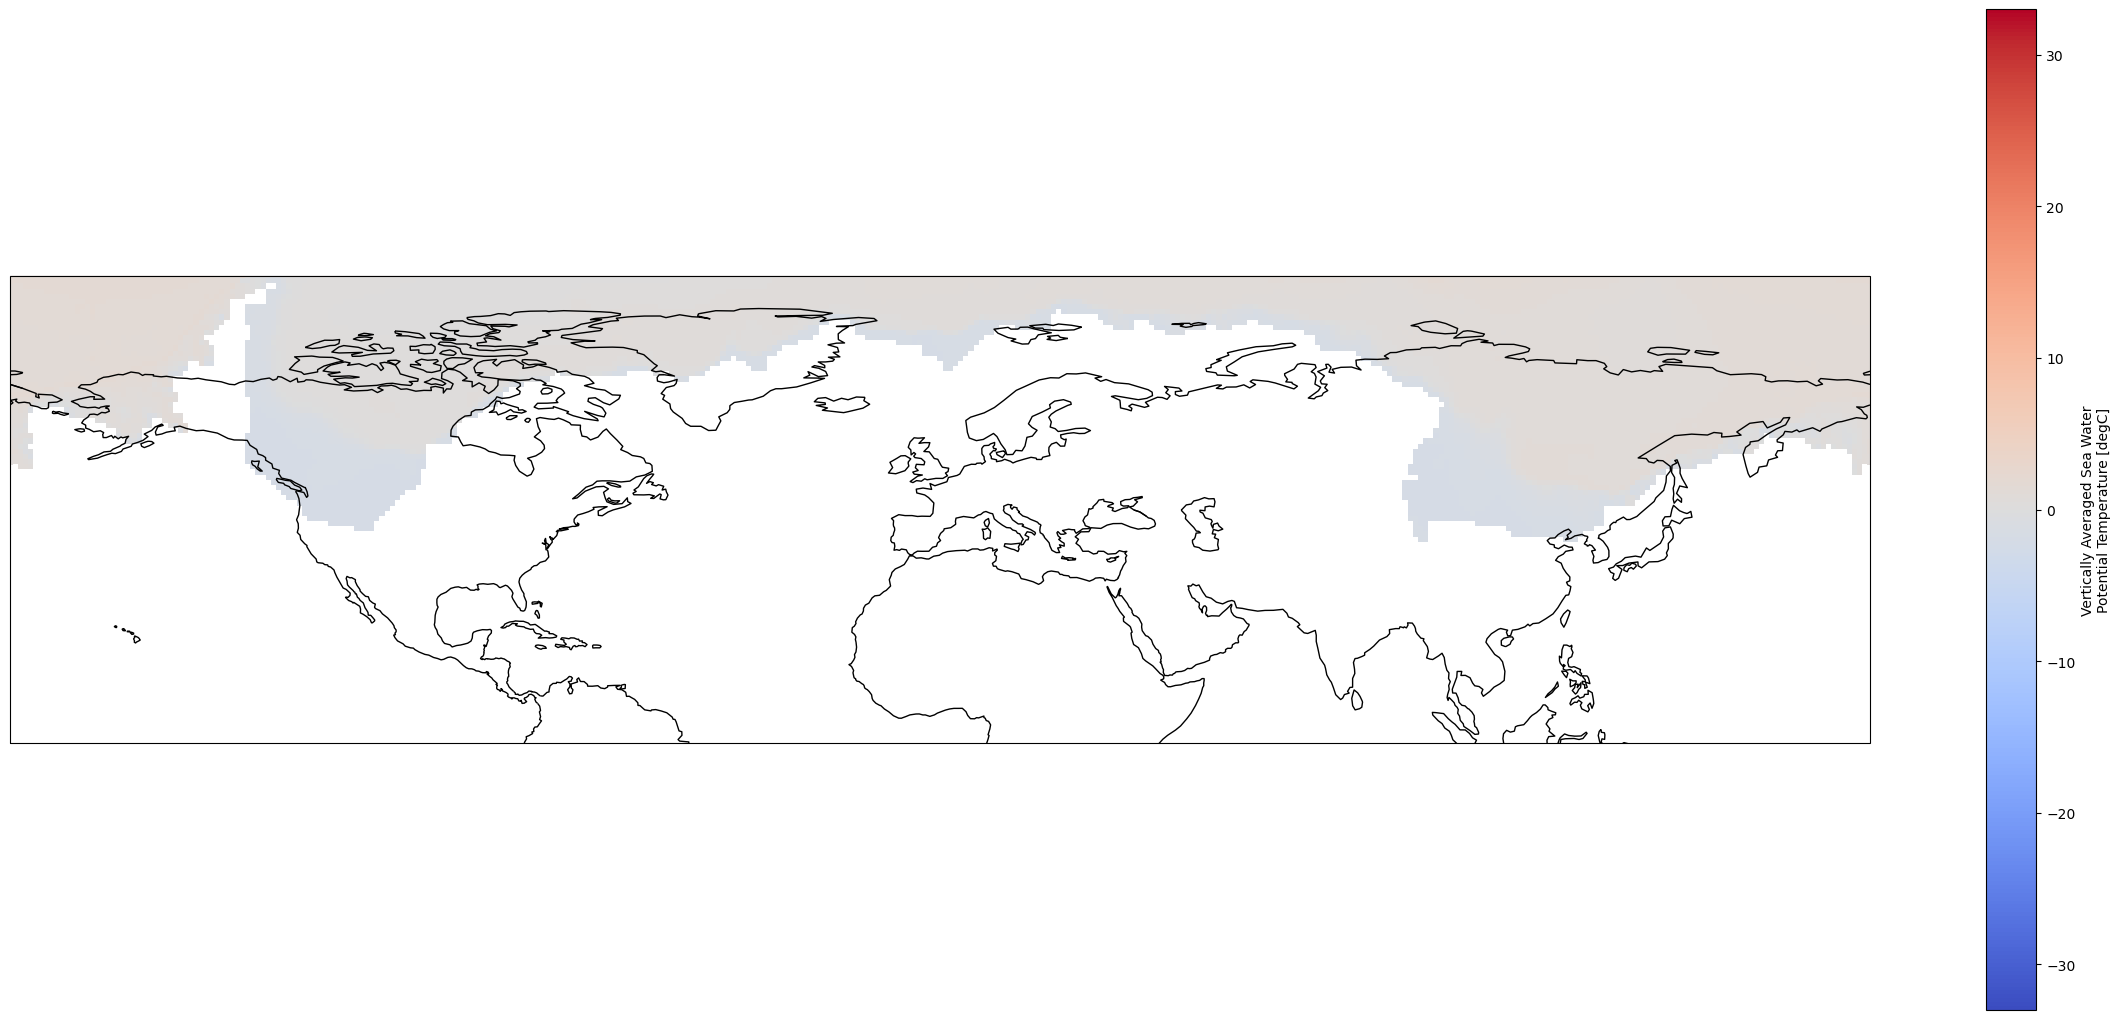
If we plot the coastlines from cartopy over the dataset, we will see that the coordinate systems of these datasets are… a bit different.
fig = plt.figure(1, figsize = [30, 13])

# Set the projection to use for plotting
ax = plt.subplot(1, 1, 1, projection=ccrs.PlateCarree())
ax.coastlines()

# Pass ax as an argument when plotting. Here we assume data is in the same coordinate reference system than the projection chosen for plotting
# isel allows to select by indices instead of the time values
pre_industrial_mean.plot.pcolormesh(ax = ax, cmap = "coolwarm")
<cartopy.mpl.geocollection.GeoQuadMesh at 0x7f49305aa990>
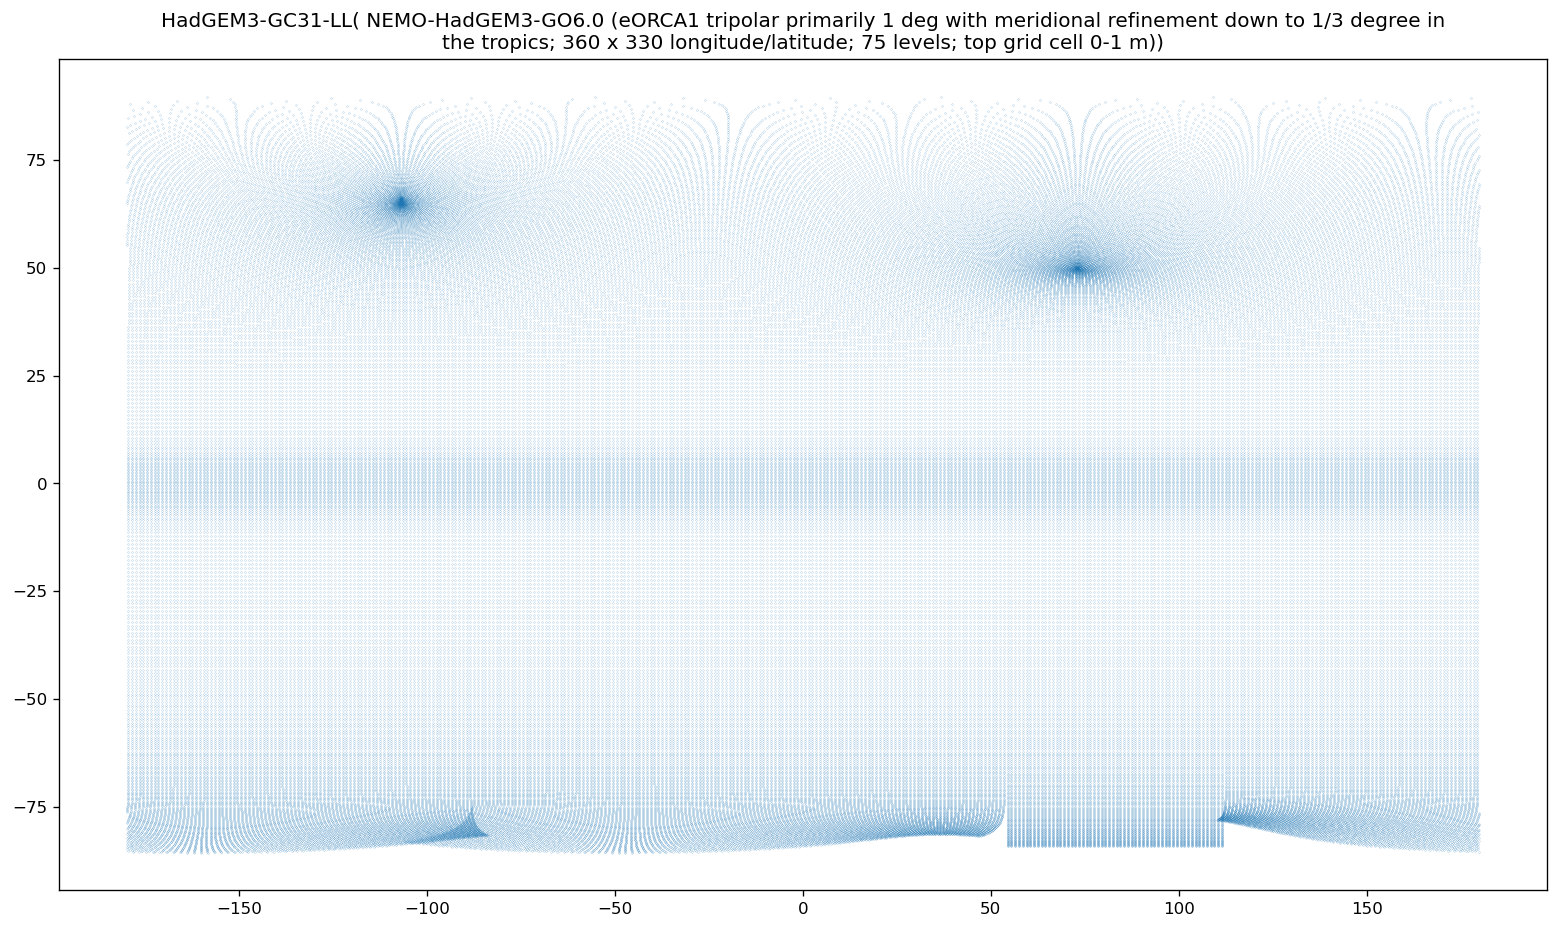
If we visualize our data set’s grid, it becomes obvious that it is far from a standard grid.
import textwrap
def plot_curv_grid(ds, var = "tos"):
        lat = cfxr.accessor._get_with_standard_name(ds, "latitude")[0]
        lon = cfxr.accessor._get_with_standard_name(ds, "longitude")[0]
        if any([i == None for i in [lat, lon]]):
            print(ds.attrs["source_id"], ": Cannot identify latitude/longitude.")
            return
        plt.figure(figsize = (16, 9), dpi=120)
        plt.scatter(x = ds[lon], y = ds[lat], s = 0.01)
        # x, y = np.meshgrid(ds[lon], ds[lat])
        # plt.scatter(x = x, y = y, s = 0.01)
        try:
            plt.title("\n".join(textwrap.wrap(ds.attrs["source_id"] + "(" + ds.attrs["source"].split("ocean:")[-1].split("\n")[0] + ")", 120)))
        except (KeyError, IndexError):
            plt.title(ds.attrs["source_id"])
plot_curv_grid(dset)
3. Reformat the grid and regridd the data set.#
As we mentioned before, the coordinates need to be re-defined.
# Later one can just install and use clisops, once functions like this are merged into the master branch
def grid_reformat(ds):

    # Define lat, lon, lat_bnds, lon_bnds
    lat = ds.lat[:, 0]
    lon = ds.lon[0, :]
    lat_bnds = np.zeros((lat.shape[0], 2), dtype = "double")
    lon_bnds = np.zeros((lon.shape[0], 2), dtype = "double")

    # From (N + 1, M + 1) shaped bounds to (N, M, 4) shaped vertices
    lat_vertices = cfxr.vertices_to_bounds(
        ds.lat_b, ("bnds", "lat", "lon")
    ).values
    lon_vertices = cfxr.vertices_to_bounds(
        ds.lon_b, ("bnds", "lat", "lon")
    ).values

    lat_vertices = np.moveaxis(lat_vertices, 0, -1)
    lon_vertices = np.moveaxis(lon_vertices, 0, -1)

    # From (N, M, 4) shaped vertices to (N, 2)  and (M, 2) shaped bounds
    lat_bnds[:, 0] = np.min(lat_vertices[:, 0, :], axis = 1)
    lat_bnds[:, 1] = np.max(lat_vertices[:, 0, :], axis = 1)
    lon_bnds[:, 0] = np.min(lon_vertices[0, :, :], axis = 1)
    lon_bnds[:, 1] = np.max(lon_vertices[0, :, :], axis = 1)

    # Create dataset
    ds_ref = xr.Dataset(
        coords = {
            "lat": (["lat"], lat.data),
            "lon": (["lon"], lon.data),
            "lat_bnds": (["lat", "bnds"], lat_bnds.data),
            "lon_bnds": (["lon", "bnds"], lon_bnds.data),
        },
    )


    # Add variable attributes to the coordinate variables
    ds_ref["lat"].attrs = {
        "bounds": "lat_bnds",
        "units": "degrees_north",
        "long_name": "latitude",
        "standard_name": "latitude",
        "axis": "Y",
    }
    ds_ref["lon"].attrs = {
        "bounds": "lon_bnds",
        "units": "degrees_east",
        "long_name": "longitude",
        "standard_name": "longitude",
        "axis": "X",
    }
    ds_ref["lat_bnds"].attrs = {
        "long_name": "latitude_bounds",
        "units": "degrees_north",
    }
    ds_ref["lon_bnds"].attrs = {
        "long_name": "longitude_bounds",
        "units": "degrees_east",
    }

    return ds_ref
# Specify a global 1deg target grid

# With clisops
#ds_out = clore.Grid(grid_instructor=(1., )).ds

# Without clisops
ds_out = grid_reformat(xe.util.grid_global(1., 1.))

ds_out
---------------------------------------------------------------------------
NameError                                 Traceback (most recent call last)
Cell In[9], line 7
      1 # Specify a global 1deg target grid
      2
      3 # With clisops
      4 #ds_out = clore.Grid(grid_instructor=(1., )).ds
      5
      6 # Without clisops
----> 7 ds_out = grid_reformat(xe.util.grid_global(1., 1.))
      9 ds_out

NameError: name 'xe' is not defined
And now we regrid the data set to a normal 1-degree global grid.
# In case of problems, activate ESMF verbose mode
import ESMF
ESMF.Manager(debug = True)

# Regridding methods
#method_list = ["bilinear", "nearest_s2d", "patch", "conservative", "conservative_normed"]
method_list = ["bilinear", "nearest_s2d", "patch"]

# Function to generate the weights
#   If grids have problems of degenerated cells near the poles there is the ignore_degenerate option
def regrid(ds_in, ds_out, method, periodic, unmapped_to_nan = True, ignore_degenerate = None):
    """Convenience function for calculating regridding weights"""
    ds_in["lat"] = ds_in["latitude"]
    ds_in["lon"] = ds_in["longitude"]
    return xe.Regridder(ds_in, ds_out, method, periodic = periodic,
                        ignore_degenerate = ignore_degenerate)
---------------------------------------------------------------------------
ModuleNotFoundError                       Traceback (most recent call last)
Cell In[10], line 2
      1 # In case of problems, activate ESMF verbose mode
----> 2 import ESMF
      3 ESMF.Manager(debug = True)
      5 # Regridding methods
      6 #method_list = ["bilinear", "nearest_s2d", "patch", "conservative", "conservative_normed"]

ModuleNotFoundError: No module named 'ESMF'
%time regridder = regrid(pre_industrial_mean, ds_out, "bilinear", periodic = True, unmapped_to_nan = True, ignore_degenerate = None)
---------------------------------------------------------------------------
NameError                                 Traceback (most recent call last)
File <timed exec>:1

NameError: name 'regrid' is not defined
regridder
---------------------------------------------------------------------------
NameError                                 Traceback (most recent call last)
Cell In[12], line 1
----> 1 regridder

NameError: name 'regridder' is not defined
regridded_ds = regridder(pre_industrial_mean, keep_attrs = True)
regridded_ds
---------------------------------------------------------------------------
NameError                                 Traceback (most recent call last)
Cell In[13], line 1
----> 1 regridded_ds = regridder(pre_industrial_mean, keep_attrs = True)
      2 regridded_ds

NameError: name 'regridder' is not defined
fig = plt.figure(1, figsize = [30, 13])

# Set the projection to use for plotting
ax = plt.subplot(1, 1, 1, projection = ccrs.PlateCarree())
ax.coastlines()

# Pass ax as an argument when plotting. Here we assume data is in the same coordinate reference system than the projection chosen for plotting
# isel allows to select by indices instead of the time values
regridded_ds.plot.pcolormesh(ax = ax, cmap = "coolwarm")
---------------------------------------------------------------------------
NameError                                 Traceback (most recent call last)
Cell In[14], line 9
      5 ax.coastlines()
      7 # Pass ax as an argument when plotting. Here we assume data is in the same coordinate reference system than the projection chosen for plotting
      8 # isel allows to select by indices instead of the time values
----> 9 regridded_ds.plot.pcolormesh(ax = ax, cmap = "coolwarm")

NameError: name 'regridded_ds' is not defined
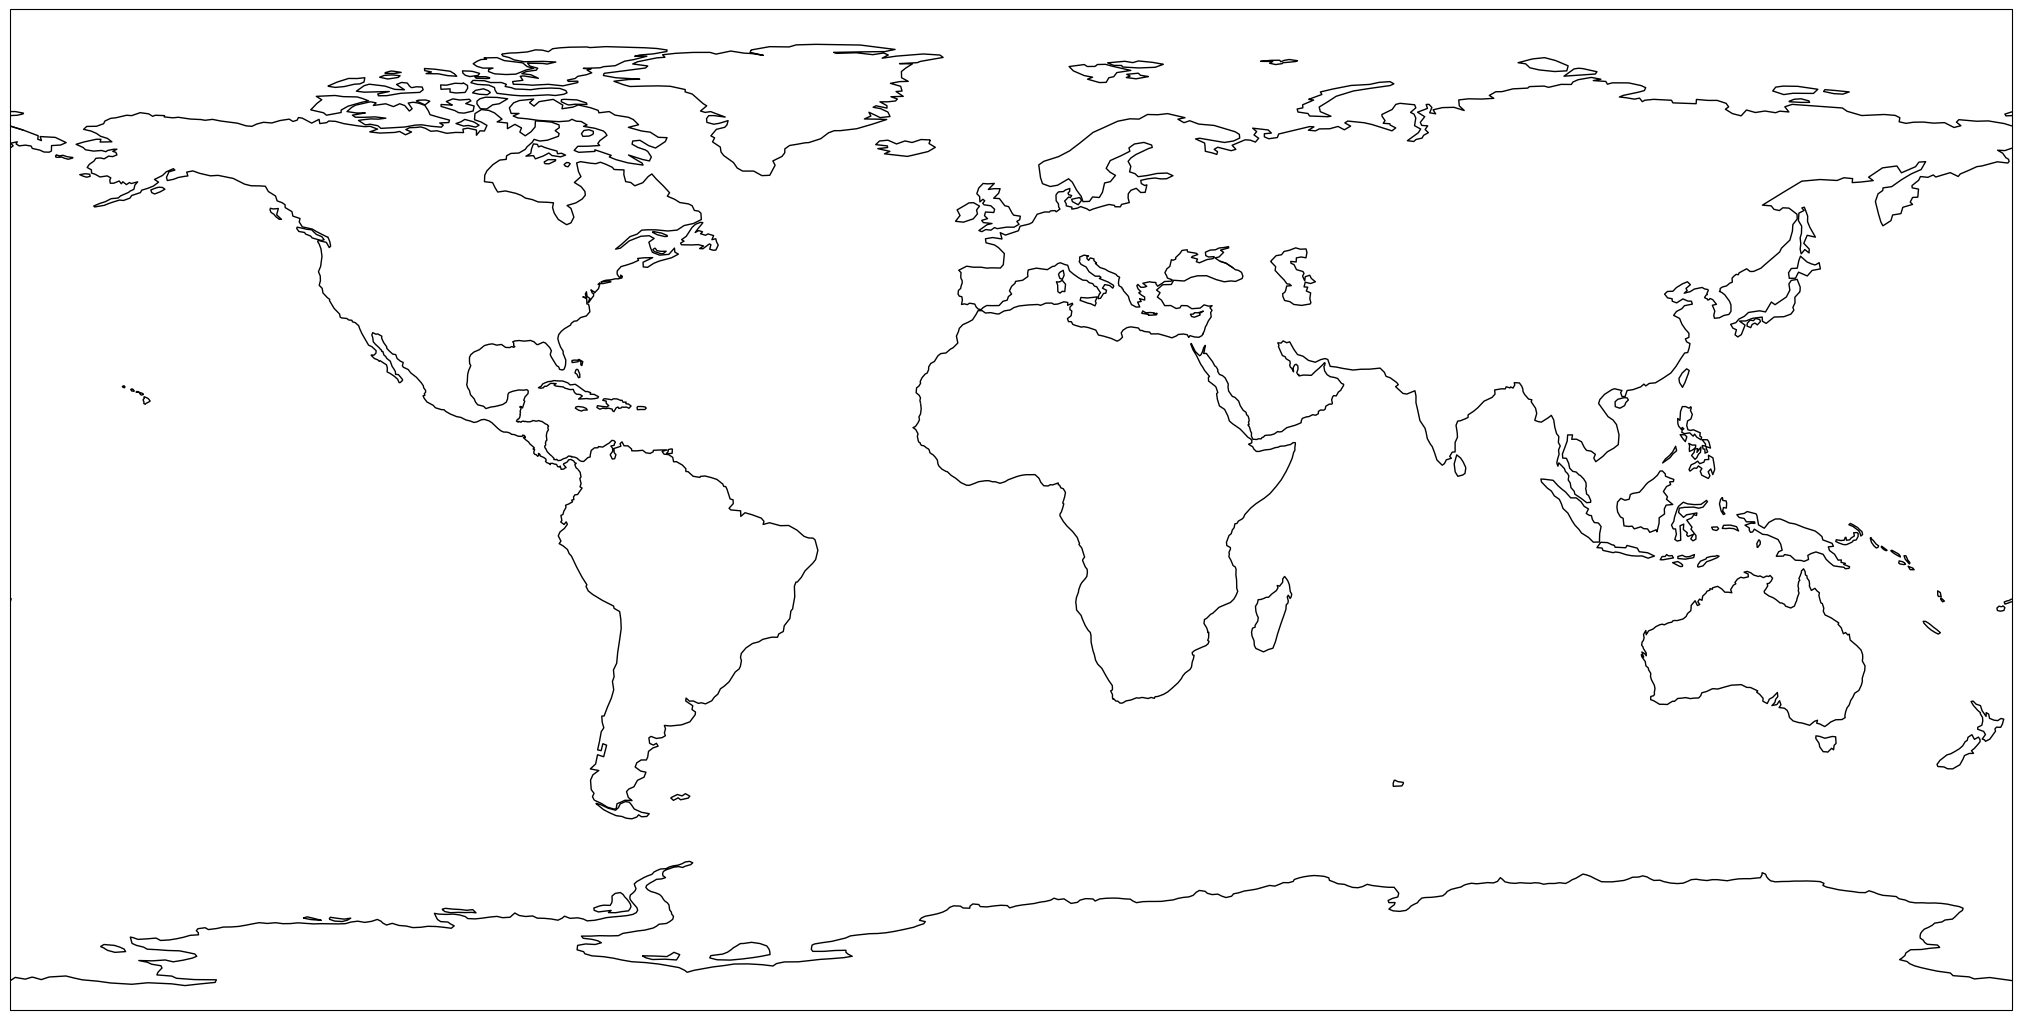
As we can see, the data has a correct CRS now.
4. Write a CRS and save the data set as a GeoTIFF#
It is pretty straitforward to write a CRS to an xarray with rioxarray. Here we used the World Geodetic System 1984 CRS which is quite common and used by default, for example in QGIS.
#You might need to rename the axes before
transformed = regridded_ds.rename({"lon":"x", "lat":"y"})

transformed = transformed.rio.write_crs("EPSG:4326")
---------------------------------------------------------------------------
NameError                                 Traceback (most recent call last)
Cell In[15], line 2
      1 #You might need to rename the axes before
----> 2 transformed = regridded_ds.rename({"lon":"x", "lat":"y"})
      4 transformed = transformed.rio.write_crs("EPSG:4326")

NameError: name 'regridded_ds' is not defined
If we want to re-project the data set to e.g., Web Mercator, wich is used by default in Google Maps and ArcGIS, we do it as follows:
transformed = transformed.rio.reproject("EPSG:3857")
---------------------------------------------------------------------------
NameError                                 Traceback (most recent call last)
Cell In[16], line 1
----> 1 transformed = transformed.rio.reproject("EPSG:3857")

NameError: name 'transformed' is not defined
And finally, saving our dataset as a GeoTIFF is as easy as this:
transformed.rio.to_raster("regridded_3857.tif")
---------------------------------------------------------------------------
NameError                                 Traceback (most recent call last)
Cell In[17], line 1
----> 1 transformed.rio.to_raster("regridded_3857.tif")

NameError: name 'transformed' is not defined