Climate Extremes Indices with CDOs according to the ETCCDI standard#
A climate index is a calculated measure for the state and/or variations of the climate system. In the field of meteorology, many definitions for different types of climate indices exist. For example, the German Weather Service defines a Klimakenntag: If a climatological parameter exceeds a specific threshold at one day, the day is considered as a specific klimakenntag.
The expert team ETCCDI has defined a core set of descriptive indices of extremes (Climate Extremes Indices, CEI) in order to
“gain a uniform perspective on observed changes in weather and climate extremes.
These indices have become a standard in the climate science community. They describe particular characteristics of extremes including frequency, amplitude and persistence.
Learning Objectives#
In this notebook, you will learn to
calculate 4 kinds of CEIs, absolute, threshold, duration and percentile-based indices according to the ETCCDI standard with CDOs
calculate running window percentiles according to the ETCCDI standard with CDOs
Requirements#
intake
cdo
from IPython.display import HTML
HTML('<iframe src="https://slides.com/wachsylon/cdoetccdi/embed" width="576" height="420" scrolling="no" frameborder="0" webkitallowfullscreen mozallowfullscreen allowfullscreen></iframe>')
/envs/lib/python3.11/site-packages/IPython/core/display.py:431: UserWarning: Consider using IPython.display.IFrame instead
  warnings.warn("Consider using IPython.display.IFrame instead")
0. Preparation#
In the following,
you will
importpackages required to runcdoin python. We use thecdobinary from the environment which was used to create the kernel. You might want to change that.you will get a time series of the variables
tasminandprwhich can be used to calculate all types of indices. We choose a subset from thehistoricalexperiment form the recent model intercomparison project CMIP6 for the time interval 1970-1989.
#set cdo binary to the one installed in the environment of the kernel
import sys
import os
cdobin=os.path.sep.join(sys.executable.split(os.path.sep)[:-1]+["cdo"])
#
#import python cdo
from cdo import *
cdo = Cdo(cdobin)
cdo.debug=True
#This prohibits that existing files are created a second time
cdo.forceOutput = False
import intake
# Path to master catalog on the DKRZ server
#dkrz_catalog=intake.open_catalog(["https://dkrz.de/s/intake"])
#
#only for the web page we need to take the original link:
dkrz_catalog=intake.open_catalog(["https://gitlab.dkrz.de/data-infrastructure-services/intake-esm/-/raw/master/esm-collections/cloud-access/dkrz_catalog.yaml"])
list(dkrz_catalog)

# Open the catalog with the intake package and name it "col" as short for "collection"
cols=dkrz_catalog._entries["dkrz_cmip6_disk"]._open_args["read_csv_kwargs"]["usecols"]+["opendap_url"]
col=dkrz_catalog.dkrz_cmip6_disk(read_csv_kwargs=dict(usecols=cols))
# Store the name of the model we chose in a variable named "climate_model"

source_id = "MPI-ESM1-2-LR" # here we choose Max-Plack Institute's Earth Sytem Model in high resolution

query = dict(
    source_id      = source_id, # the model
    variable_id    = ["tasmin","pr"],
    table_id       = "day", # daily
    experiment_id  = "historical", #
    member_id      = "r10i1p1f1", # "r" realization, "i" initialization, "p" physics, "f" forcing
    time_range     = "19700101-19891231"
)

# Intake looks for the query we just defined in the catalog of the CMIP6 data pool at DKRZ
col.df["uri"]=col.df["uri"].str.replace("lustre/","lustre02/")
cat = col.search(**query)

# Show query results
cat.df
| activity_id | institution_id | source_id | experiment_id | member_id | table_id | variable_id | grid_label | dcpp_init_year | version | time_range | opendap_url | project | format | uri | |
|---|---|---|---|---|---|---|---|---|---|---|---|---|---|---|---|
| 0 | CMIP | MPI-M | MPI-ESM1-2-LR | historical | r10i1p1f1 | day | pr | gn | NaN | v20190710 | 19700101-19891231 | http://esgf3.dkrz.de/thredds/dodsC/cmip6/CMIP/... | CMIP6 | netcdf | /work/ik1017/CMIP6/data/CMIP6/CMIP/MPI-M/MPI-E... |
| 1 | CMIP | MPI-M | MPI-ESM1-2-LR | historical | r10i1p1f1 | day | tasmin | gn | NaN | v20190710 | 19700101-19891231 | http://esgf3.dkrz.de/thredds/dodsC/cmip6/CMIP/... | CMIP6 | netcdf | /work/ik1017/CMIP6/data/CMIP6/CMIP/MPI-M/MPI-E... |
#download files
urlpr=cat.df[cat.df["variable_id"] == "pr"]["opendap_url"].values[0].replace("dodsC","fileServer")
urltas=cat.df[cat.df["variable_id"] == "tasmin"]["opendap_url"].values[0].replace("dodsC","fileServer")
!wget {urlpr}
!wget {urltas}
--2023-07-05 14:47:13--  http://esgf3.dkrz.de/thredds/fileServer/cmip6/CMIP/MPI-M/MPI-ESM1-2-LR/historical/r10i1p1f1/day/pr/gn/v20190710/pr_day_MPI-ESM1-2-LR_historical_r10i1p1f1_gn_19700101-19891231.nc
Resolving esgf3.dkrz.de (esgf3.dkrz.de)... 136.172.34.205
Connecting to esgf3.dkrz.de (esgf3.dkrz.de)|136.172.34.205|:80... connected.
HTTP request sent, awaiting response...
200 200
Length: 373269979 (356M) [application/x-netcdf]
Saving to: ‘pr_day_MPI-ESM1-2-LR_historical_r10i1p1f1_gn_19700101-19891231.nc’


          pr_day_MP   0%[                    ]       0  --.-KB/s
pr_day_MPI 4%[ ] 14.54M 72.6MB/s
pr_day_MPI- 6%[> ] 22.49M 19.1MB/s
pr_day_MPI-E 13%[=> ] 49.65M 36.1MB/s
pr_day_MPI-ES 20%[===> ] 73.99M 46.5MB/s
pr_day_MPI-ESM 24%[===> ] 85.49M 34.7MB/s
pr_day_MPI-ESM1 30%[=====> ] 110.27M 41.4MB/s
pr_day_MPI-ESM1- 34%[=====> ] 122.00M 34.3MB/s eta 7s
pr_day_MPI-ESM1-2 41%[=======> ] 147.79M 39.3MB/s eta 7s
pr_day_MPI-ESM1-2- 47%[========> ] 168.00M 42.4MB/s eta 7s
pr_day_MPI-ESM1-2-L 49%[========> ] 177.96M 36.8MB/s eta 5s
r_day_MPI-ESM1-2-LR 59%[==========> ] 210.42M 41.7MB/s eta 5s
_day_MPI-ESM1-2-LR_ 64%[===========> ] 228.49M 37.9MB/s eta 3s
day_MPI-ESM1-2-LR_h 70%[=============> ] 249.46M 40.0MB/s eta 3s
ay_MPI-ESM1-2-LR_hi 75%[==============> ] 267.96M 37.3MB/s eta 2s
y_MPI-ESM1-2-LR_his 87%[================> ] 311.97M 42.2MB/s eta 2s
_MPI-ESM1-2-LR_hist 97%[==================> ] 345.72M 45.5MB/s eta 2s
pr_day_MPI-ESM1-2-L 100%[===================>] 355.98M  46.7MB/s    in 7.6s

2023-07-05 14:47:21 (46.7 MB/s) - ‘pr_day_MPI-ESM1-2-LR_historical_r10i1p1f1_gn_19700101-19891231.nc’ saved [373269979/373269979]
--2023-07-05 14:47:22--  http://esgf3.dkrz.de/thredds/fileServer/cmip6/CMIP/MPI-M/MPI-ESM1-2-LR/historical/r10i1p1f1/day/tasmin/gn/v20190710/tasmin_day_MPI-ESM1-2-LR_historical_r10i1p1f1_gn_19700101-19891231.nc
Resolving esgf3.dkrz.de (esgf3.dkrz.de)... 136.172.34.205
Connecting to esgf3.dkrz.de (esgf3.dkrz.de)|136.172.34.205|:80... connected.
HTTP request sent, awaiting response...
200 200
Length: 251822014 (240M) [application/x-netcdf]
Saving to: ‘tasmin_day_MPI-ESM1-2-LR_historical_r10i1p1f1_gn_19700101-19891231.nc’


          tasmin_da   0%[                    ]       0  --.-KB/s
tasmin_day 6%[> ] 16.50M 82.5MB/s
tasmin_day_ 10%[=> ] 24.60M 21.7MB/s
tasmin_day_M 18%[==> ] 43.92M 33.0MB/s
tasmin_day_MP 24%[===> ] 57.97M 25.4MB/s
tasmin_day_MPI 35%[======> ] 85.95M 34.3MB/s
tasmin_day_MPI- 44%[=======> ] 107.26M 39.7MB/s
tasmin_day_MPI-E 55%[==========> ] 133.95M 46.0MB/s
tasmin_day_MPI-ES 65%[============> ] 158.27M 50.9MB/s eta 2s
tasmin_day_MPI-ESM 75%[==============> ] 181.20M 54.7MB/s eta 2s
tasmin_day_MPI-ESM1 83%[===============> ] 200.44M 57.1MB/s eta 2s
asmin_day_MPI-ESM1- 92%[=================> ] 222.06M 59.8MB/s eta 2s
tasmin_day_MPI-ESM1 100%[===================>] 240.16M  62.0MB/s    in 3.9s

2023-07-05 14:47:27 (62.0 MB/s) - ‘tasmin_day_MPI-ESM1-2-LR_historical_r10i1p1f1_gn_19700101-19891231.nc’ saved [251822014/251822014]
#define temporary output files
prorig = cat.df[cat.df["variable_id"] == "pr"]["opendap_url"].values[0].split('/')[-1]
tasorig = cat.df[cat.df["variable_id"] == "tasmin"]["opendap_url"].values[0].split('/')[-1]
prHamburg    ="pr_hamburg.nc"
tasminHamburg="tasmin_hamburg.nc"
#Select a subarea because memory might not be large enough
#and change units

prep_ts="-sellonlatbox,9,10,53,54 "
prep_pr="-mulc,86400 "+prep_ts
pr=cdo.mulc("1",
              input=prep_pr+prorig,
              output=prHamburg)
tasmin=cdo.mulc("1",
              input=prep_ts+tasorig,
              output=tasminHamburg)
Found operator:mulc
# DEBUG - start =============================================================
CALL  :/envs/bin/cdo -O -s -mulc,1 -mulc,86400 -sellonlatbox,9,10,53,54 pr_day_MPI-ESM1-2-LR_historical_r10i1p1f1_gn_19700101-19891231.nc pr_hamburg.nc
STDOUT:
STDERR:
# DEBUG - end ===============================================================
RETURNCODE:0
# DEBUG - start =============================================================
CALL  :/envs/bin/cdo -O -s -mulc,1 -sellonlatbox,9,10,53,54 tasmin_day_MPI-ESM1-2-LR_historical_r10i1p1f1_gn_19700101-19891231.nc tasmin_hamburg.nc
STDOUT:
STDERR:
# DEBUG - end ===============================================================
RETURNCODE:0
1. Absolute indices#
txx,txn,tnx,tnndaily temperature range
dtr, intensity intdexsdiirx1day,rx5day,prcptot
While the other 3 categories of indices are defined in temporal units, the absolute indices have the same units as the input variable. The absolute indices are useful because its values
can often be related to extreme events that affect human society and the natural environment
Absolute indices are easy to compute with basic CDOs. E.g., the minimum of daily minimum temperature can be calculated with
cdo yearmin tasmin tnn.nc
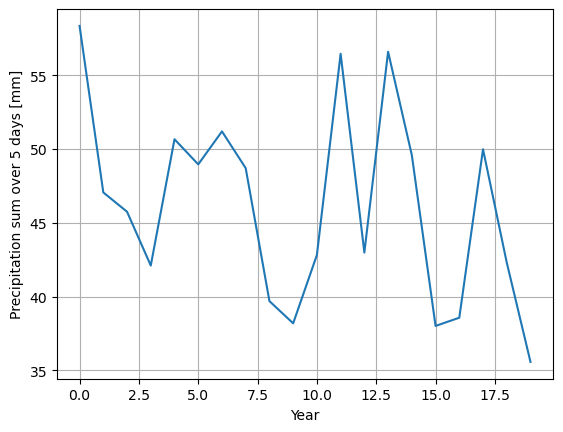
However, the etccdi_ indices produces variables named according to the ETCCDI standard. Also, you can specify an output frequency. When it comes to the precipiation related absolute indices, you cannot work with basic cdos anymore. In the following, we show you an example for the highest five day precipitation sum:
#Highest 5day percipitation sum
!export CDO_TIMESTAT_DATE="last"
#$cdo eca_rx5day,50,freq=year -runsum,5
rx5day="rx5day_hamburg.nc"
rx5day_values = cdo.etccdi_rx5day(input="-runsum,5 "+prHamburg,
                                  output="rx5day_hamburg.nc",
                                  returnCdf=True).variables[
    "rx5dayETCCDI"][:]
rx5day_values = rx5day_values.flatten()
Found operator:etccdi_rx5day
# DEBUG - start =============================================================
CALL  :/envs/bin/cdo -O -s -f nc -etccdi_rx5day -runsum,5 pr_hamburg.nc rx5day_hamburg.nc
STDOUT:
STDERR:
# DEBUG - end ===============================================================
RETURNCODE:0
import matplotlib.pyplot as plt
plt.plot(rx5day_values)
plt.grid()
plt.xlabel("Year")
plt.ylabel("Precipitation sum over 5 days [mm]")
plt.show()
2. Threshold exceedances#
frost days
fd, ice daysid, summer dayssu, tropical nightstrr1mm,r10mm,r20mm
Threshold based CEIs are
Indices based on the count of days crossing certain fixed thresholds (for example, the 0°C threshold as used in the frost days index FD) can also be related to observed impacts, in particular if the thresholds refer to values of physical, hydrological or biological significance.
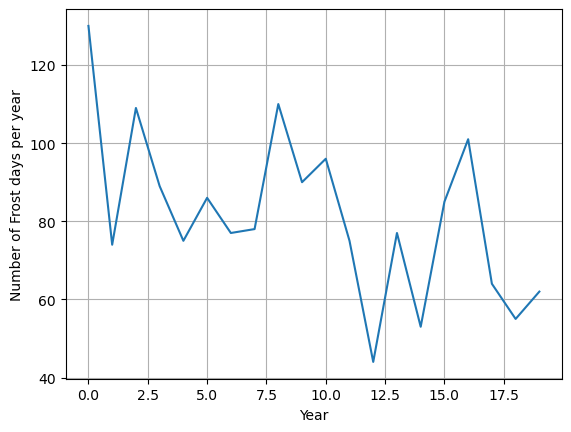
We can calculate frost days with yearly frequency as follows:
#frost days
# $cdo eca_fd,freq=year
fd_values = cdo.etccdi_fd(input=tasminHamburg,
                          output="fd_hamburg.nc",
                          returnCdf=True).variables[
                          "fdETCCDI"][:]
fd_values = fd_values.flatten()
Found operator:etccdi_fd
# DEBUG - start =============================================================
CALL  :/envs/bin/cdo -O -s -f nc -etccdi_fd tasmin_hamburg.nc fd_hamburg.nc
STDOUT:
STDERR:
# DEBUG - end ===============================================================
RETURNCODE:0
import matplotlib.pyplot as plt
plt.plot(fd_values)
plt.grid()
plt.xlabel("Year")
plt.ylabel("Number of Frost days per year")
plt.show()
3. Create Percentiles#
In contrast to fixed thresholds based indices, for some indices individual grid cell percentiles for each day are used as thresholds. Using only one day per day results in a rather small sample size which is equal to the lenght of the base period. In climate science, this base period is usually 20 or 30 years long. In order to construct percentiles that are more meaningful, we use a running window around the target day to enlarge the sample size. We will run ydrunpctl which also requires ydrunmin and ydrunmax.
The running minimum and running maximum are needed as input files for ydrunpctl so that the operator can create bins for a histogram. However, CEIs are based not on bin-sorted histograms but use a value-sorted histogram. Such a histogram can only be created if there is enough memory to save all values. This is only the case, if the environment parameter CDO_PCTL_NBINS can be set to
nbins="$((windowsize*(end_year-start_year+1)*2+2))"
which is in our case
nbins="$((5*(1989-1970+1)*2+2))"
nbins=202
#and
export CDO_PCTL_NBINS=202
Whether this is possible depends on the system.
Two new arguments have been introduced for the ydrun* operators in comparison to older cdo versions for matching the requirements defined by the ETCCDI standard calculation methods:
rm : The read_method can be set to
cfor “circular” which takes into account the last time steps at the begin of the time period and vise versa. Otherwise, the first and last time steps are not used as often as the other time steps in the calculations.pm : Since a lot of methods exist to calculate a percentile, CDO will allow to set percentileMethod in the operator call. ETCCDI recommends a method implemented in the software language R as type8. This is right now the only option for the argument.
The resulting command line calls of these operators required for CEIs look like:
cdo ydrunmin,5,rm=c tasmin_hamburg.nc tasmin_runmin.nc
cdo ydrunmax,5,rm=c tasmin_hamburg.nc tasmin_runmax.nc
cdo ydrunpctl,5,rm=c,pm=r8 tasmin_runmin.nc tasmin_runmax.nc tn10thresh.nc
windowsize=5
readMethod="circular"
percentileMethod="rtype8"
#  $cdo ydrunmin,5,rm=c $tasminMerged $tasminrunmin
cdo.ydrunmin(windowsize,"rm="+readMethod,
             input=tasminHamburg,
             output="tasmin_runmin.nc")
Found operator:ydrunmin
# DEBUG - start =============================================================
CALL  :/envs/bin/cdo -O -s -ydrunmin,5,rm=circular tasmin_hamburg.nc tasmin_runmin.nc
STDOUT:
STDERR:
# DEBUG - end ===============================================================
RETURNCODE:0
'tasmin_runmin.nc'
#  $cdo ydrunmax,5,rm=c $tasminMerged $tasminrunmin
cdo.ydrunmax(windowsize,"rm="+readMethod,
             input=tasminHamburg,
             output="tasmin_runmax.nc")
Found operator:ydrunmax
# DEBUG - start =============================================================
CALL  :/envs/bin/cdo -O -s -ydrunmax,5,rm=circular tasmin_hamburg.nc tasmin_runmax.nc
STDOUT:
STDERR:
# DEBUG - end ===============================================================
RETURNCODE:0
'tasmin_runmax.nc'
#If you set this environment parameter,
#histograms are ordered values instead of bins
!export CDO_PCTL_NBINS=202
#  $cdo subc,273.15 -ydrunpctl,10,5,pm=r8,rm=c $tasminMerged ${tasminrunmin} ${tasminrunmax} ${tn10thresh}
cdo.ydrunpctl(10,windowsize,"rm="+readMethod,"pm="+percentileMethod,
             input=tasminHamburg+" tasmin_runmin.nc tasmin_runmax.nc",
             output="tn10thresh.nc")
#  $cdo subc,273.15 -ydrunpctl,90,5,pm=r8,rm=c $tasminMerged ${tasminrunmin} ${tasminrunmax} ${tn10thresh}
cdo.ydrunpctl(90,windowsize,"rm="+readMethod,"pm="+percentileMethod,
             input=tasminHamburg+" tasmin_runmin.nc tasmin_runmax.nc",
             output="tn90thresh.nc")
Found operator:ydrunpctl
# DEBUG - start =============================================================
CALL  :/envs/bin/cdo -O -s -ydrunpctl,10,5,rm=circular,pm=rtype8 tasmin_hamburg.nc tasmin_runmin.nc tasmin_runmax.nc tn10thresh.nc
STDOUT:
STDERR:
# DEBUG - end ===============================================================
RETURNCODE:0
# DEBUG - start =============================================================
CALL  :/envs/bin/cdo -O -s -ydrunpctl,90,5,rm=circular,pm=rtype8 tasmin_hamburg.nc tasmin_runmin.nc tasmin_runmax.nc tn90thresh.nc
STDOUT:
STDERR:
# DEBUG - end ===============================================================
RETURNCODE:0
'tn90thresh.nc'
4. Duration indices#
cold spell duration index
csdi, warm spell duration indexwsdiconsecutive dry days
cdd, consecutive wet dayscwdgrowing season lengths
gsl
Duration indices are self-explanatory. They allow to characterize periods of extremes. In comparison to older eca_ indices, the etccdi_ indices implemented in cdo have two major changes. They
count periods over overlapping years (or month, depending on the output frequency) and the final period will get the time stamp of the last contributing day.
allow to have less time steps in the percentile threshold file than in the original time series file.
The corresponding command line call looks like
cdo eca_cwfi,6,freq=year tasminHamburg.nc tn10thresh.nc csdi_hamburg.nc
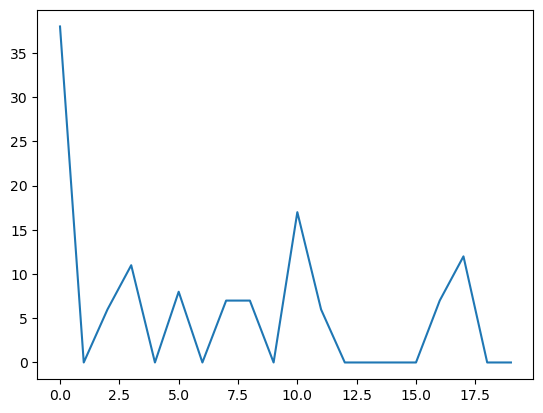
#Cold spell duration index (cold wave index)
csdi="csdi_hamburg.nc"
csdiValues = cdo.etccdi_csdi(6,"freq=year",
             input=tasminHamburg+" tn10thresh.nc",
             output=csdi,
            returnCdf=True).variables['csdiETCCDI'][:]
csdiValues = csdiValues.flatten()
Found operator:etccdi_csdi
# DEBUG - start =============================================================
CALL  :/envs/bin/cdo -O -s -f nc -etccdi_csdi,6,freq=year tasmin_hamburg.nc tn10thresh.nc csdi_hamburg.nc
STDOUT:
STDERR:
# DEBUG - end ===============================================================
RETURNCODE:0
plt.plot(csdiValues)
plt.show()
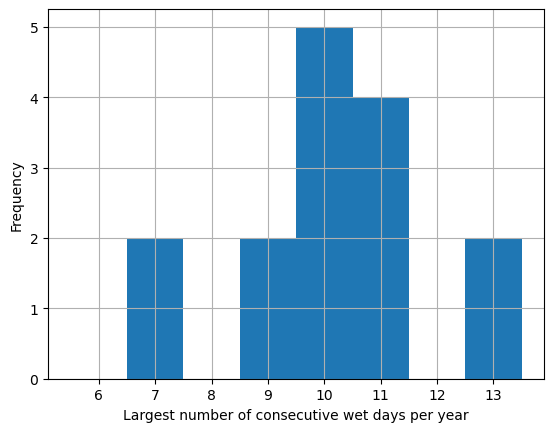
#Consecutive Wet Days
#Precipitation threshold [mm]:
pt=1
#Minimum number of days exceeded for a second variable:
md=5
#!cdo eca_cwd,1,5,freq=year prHamburg.nc cwd_hamburg.nc
cwd_values = cdo.etccdi_cwd(input=prHamburg,
            output="cwdHamburg.nc",
            returnCdf=True).variables[
            "cwdETCCDI"][:]
cwd_values = cwd_values.flatten()
Found operator:etccdi_cwd
# DEBUG - start =============================================================
CALL  :/envs/bin/cdo -O -s -f nc -etccdi_cwd pr_hamburg.nc cwdHamburg.nc
STDOUT:
STDERR:
# DEBUG - end ===============================================================
RETURNCODE:0
plt.hist(cwd_values,bins= [5.5,6.5,7.5,8.5,
                           9.5,10.5,11.5,12.5,13.5])
plt.grid()
plt.xlabel("Largest number of consecutive"
           " wet days per year")
plt.ylabel("Frequency")
plt.show()
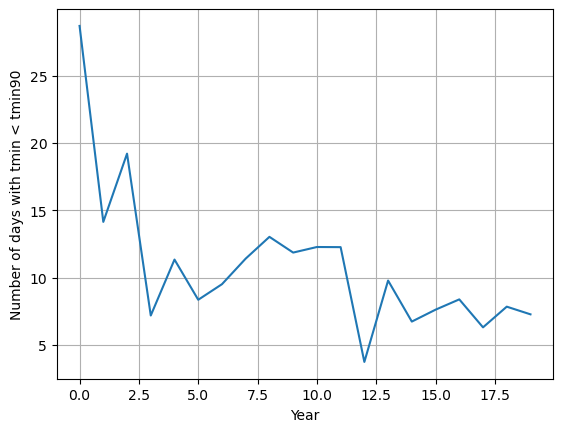
5. Percentile based indices#
tx10p tx90p tn10p tn90 r95p r99p
The reason for choosing mostly percentile thresholds rather than fixed thresholds is
the number of days exceeding percentile thresholds is more evenly distributed in space and is meaningful in every region”
The temperature related percentile based indices (tx90p, tx10p, tn90p, tn10p) require a special percentile calculation method for years that lie inside the base period. For that years, bootstrapping must be applied where the base period is modified: the index year is taken from the base period and is replaced by another year. Then, the percentile as well as the index is calculated for the new 30 year base period. This is done 29 times so that each year from the base period will be accounted twice. In the end, the mean of 29 indices is taken.
Therefore, the operators need input arguments:
The window size (5)
The start year of the bootstrapping interval (1970)
The end year of the bootstrapping interval (1989)
The output frequency
The corresponding command line call looks like:
cdo etccdi_tn10p,5,1970,1989,freq=year tasmin_hamburg.nc tasmin_runmin.nc tasmin_runmax.nc tn10p_hamburg.nc
!rm tn10p_hamburg.nc
!export CDO_PCTL_NBINS=302
tn10p_values = cdo.etccdi_tn10p(5,1970,1989,"freq=year",
                 input=tasminHamburg+" tasmin_runmin.nc tasmin_runmax.nc",
                output="tn10p_hamburg.nc",
                returnCdf=True).variables["tn10pETCCDI"][:]
tn10p_values = tn10p_values.flatten()
rm: cannot remove 'tn10p_hamburg.nc': No such file or directory
Found operator:etccdi_tn10p
# DEBUG - start =============================================================
CALL  :/envs/bin/cdo -O -s -f nc -etccdi_tn10p,5,1970,1989,freq=year tasmin_hamburg.nc tasmin_runmin.nc tasmin_runmax.nc tn10p_hamburg.nc
STDOUT:
STDERR:
# DEBUG - end ===============================================================
RETURNCODE:0
import matplotlib.pyplot as plt
plt.plot(tn10p_values)
plt.grid()
plt.xlabel("Year")
plt.ylabel("Number of days with tmin < tmin90")
plt.show()
Used data#
We acknowledge the CMIP community for providing the climate model data, retained and globally distributed in the framework of the ESGF. The CMIP data of this study were replicated and made available for this study by the DKRZ.”